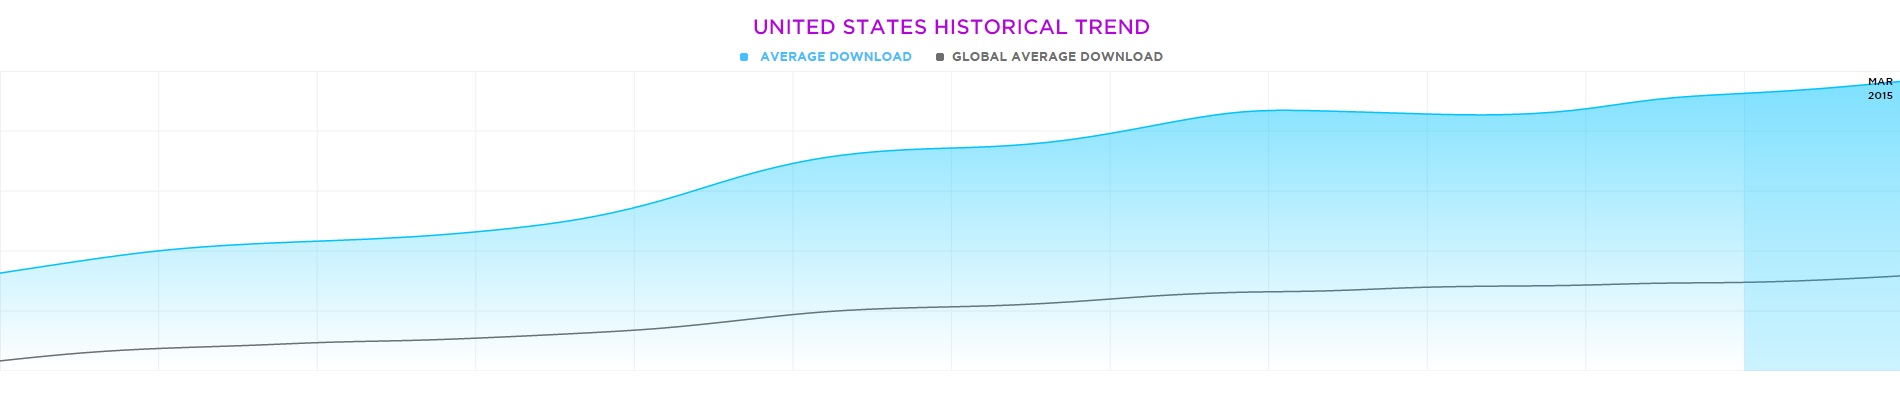

The most recent average US download speed from Ookla Speedtest for March 2014, is 33.9Mbps (these numbers are Broadband only, no Mobile tests are included). In April 2014, the average speed was just 23.9Mbps. This jump in speed moves the United States to 27th in average download speed out of 199 counties; globally the average download speed is 22.3Mbps.
The US, often considered behind in internet speed, is now pulling ahead of several major countries such as: United Kingdom 30.18Mbps, Germany 29.95Mbps, Spain 28.28Mbps, Russia 27.7Mbps and Ireland 27.29Mbps. However, the US at 27th out of 199 countries is still well behind countries such as South Korea 84.31Mbps and Japan 60.49Mbps.
Much of the growth has come in new areas of the US. In October 2014, Washington was not even in the top 10 states for download speed, and now has the fastest average speed. Additionally, North Dakota and Utah joined Washington in the top 10 fastest states.
The top ten states for average internet speeds in March 2015:
- Washington 45.6Mbps
- Missouri 41.21Mbps
- New York 40.86Mbps
- California 40.8Mbps
- Utah 40.47Mbps
- Delaware 40.03Mbps
- Rhode Island 39.76Mbps
- New Jersey 39.28Mbps
- Massachusetts 38.57Mbps
- North Dakota 37.84Mbps
The top ten states for average internet speeds in October 2014 were:
- New York 39.24Mbps
- Delaware 38.92Mbps
- New Jersey 38.86Mbps
- Maryland 36.92Mbps
- Missouri 36.62Mbps
- California 35.36Mbps
- Rhode Island 35.24Mbps
- Virginia 35.09Mbps
- Massachusetts 34.90Mbps
- Nevada 34.55Mbps
Top 5 cities with the fastest average speed in March 2015:
- Kansas City, MO 96.66Mbps
- Austin, TX 74.65Mbps
- Huntington Beach, CA 58.2Mbps
- New York, NY 53.3Mbps
- North Hollywood, CA 53.04Mbps
The top 5 cities with the fastest average speed in October 2014 were:
- Kansas City, MO 68.59Mbps
- Austin, TX 68.27Mbps
- Huntington Beach, CA 50.52Mbps
- Flushing, NY 49.83Mbps
- New York, NY 48.24Mbps
The top 5 major ISPs in the US in March 2015 are (note: Ookla did not include Google Fiber in this list):
- Verizon FiOS 43.2Mbps
- Comcast 42.7Mbps
- Cox 41.75Mbps
- Time Warner Cable 40.35Mbps
- Charter Communications 39.7Mbps
The top 5 major ISPs in the US in 2014 were:
- Google Fiber 230.69Mbps
- Verizon FIOS 42.27Mbps
- Cox 39.42Mbps
- Comcast 38.70Mbps
- Charter Communications 38.45Mbps
Clearly, ISPs are putting a lot of work into improving their services both on the backbone and at the last mile. As more and more Americans move to cut the cord and get their TV online, a faster internet is needed. Hopefully, these numbers continue to improve and will soon bring additional options to cord cutting Americans.
These numbers are the average from millions of tests run on Ookla websites in the last 30 days. The numbers are limited to tests that take place within 300 miles of the client and the host. You can view the speed test results here.
More about the numbers in this report from Ookla.
An index is traditionally defined as a numerical scale used to compare variables with one another or with some reference number. For purposes of the NetIndex, Ookla defines an index as a weighted average of data collected over the 30 most recent days.
To calculate an index, Ookla first ensures that distance and infrastructure bottlenecks have a minimal impact on accuracy. To do this, we track the distance between the test location and the Ookla Speedtest server. Thanks to the breadth of our infrastructure, we have a server within 300 miles for the vast majority of the world population.
To determine the averages for broadband download and upload, we first average one hour’s worth of test results for each unique IP to get the IP Averages. Next, we average all of the IP Averages for one hour to determine the Hourly Average. From there, we average all of the Hourly Averages for one day to find the Daily Average. Finally, we average all of the Daily Averages for up to 30 days to get the final value.
With mobile download and upload, the averages are based on one day’s worth of tests from each device to first determine the Device Averages, which is then averaged to determine the Daily Average. We then average the Daily Averages for up to 30 days to determine the final value.
Nightly, we review 24-hour increments until we identify 30 days of data with acceptable parameters. To ensure the index value is current, we do not go back further than six months to find those 30 days of data used to compute the final index value. We ignore days where the average distance is more than 300 miles to ensure events, such as server downtime, do not affect the aggregated number.
Please follow us on Twitter or like us on our new Facebook page.